The first quarter earnings season is largely in the books, and it was excellent. In fact, S&P 500 earnings per share (EPS) would have been up double digits in the quarter if not for a big loss Bristol Myers Squibb (BMY) absorbed in an acquisition. Even with that nearly three-point drag from the drugmaker, a nearly 7% increase in earnings — the biggest since the first quarter of 2022 — is impressive. Big tech strength was again the primary driver, and estimates impressively rose.
IMPRESSIVE NUMBERS
In our earnings preview commentary on April 8, 2024, we predicted three to four percentage points of upside to the then-consensus estimate of 3%. It turns out that estimate will be right on the money, with earnings growth tracking near 7%. That sounds good, and it is, but it could’ve easily been quite a bit better. If not for BMY, that number would be about 9.5%. Remove biotech and pharmaceuticals and S&P 500 EPS would be up 10.5%, with about 20 S&P 500 companies still left to report.
That said, all results count, as there are always big drags from somewhere. But that doesn’t change the fact that earnings are currently growing at a solid mid-to-high-single-digit pace with a realistic opportunity for even stronger growth in the coming quarters.
HIGH SINGLE-DIGIT S&P 500 EARNINGS GROWTH BECOMING THE NORM
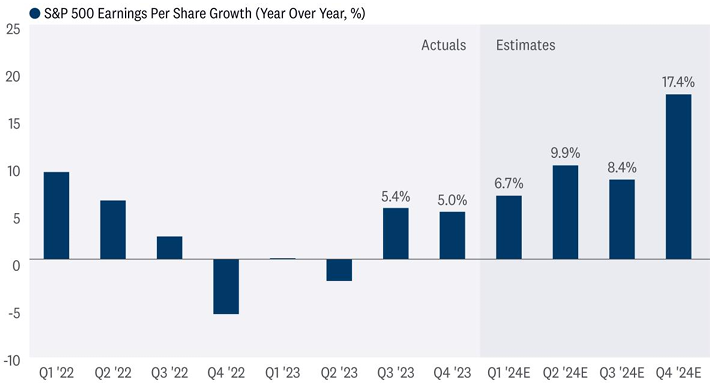
Source: LPL Research, FactSet 5/23/24
Indexes are unmanaged and cannot be invested in directly. Estimates may not develop as predicted. Past performance is no guarantee of future results.
MARGINS ON THE UPSWING AND DON’T APPEAR PARTICULARLY STRETCHED
Better-than-expected profit margins played a role in the strong first quarter numbers. The S&P 500 net margin is tracking to 12.3% for the first quarter, up from 12.2% in the seasonally stronger fourth quarter. That doesn’t sound great, but given consumers are starting to push back against higher prices, a developing theme echoed by Starbucks (SBUX), McDonald’s (MCD), Target (TGT), and others, and the first quarter is seasonally weak, this is a solid result.
If companies can continue to control costs, then improving margins for the rest of the year seems doable. Economic growth is supportive. Wage pressures seem to be stabilizing as the job market loosens up a bit. Consumer prices are increasing at a faster pace than wholesale prices, using the latest readings for the Consumer Price Index (CPI) and Producer Price Index (PPI), which supports margins. And margins in healthcare and energy are depressed and poised to reverse. One risk is further consumer pushback on high prices as savings dwindle. Higher commodity and borrowing costs present other potential headwinds.
EXCELLENT PROSPECTS FOR MARGIN IMPROVEMENT
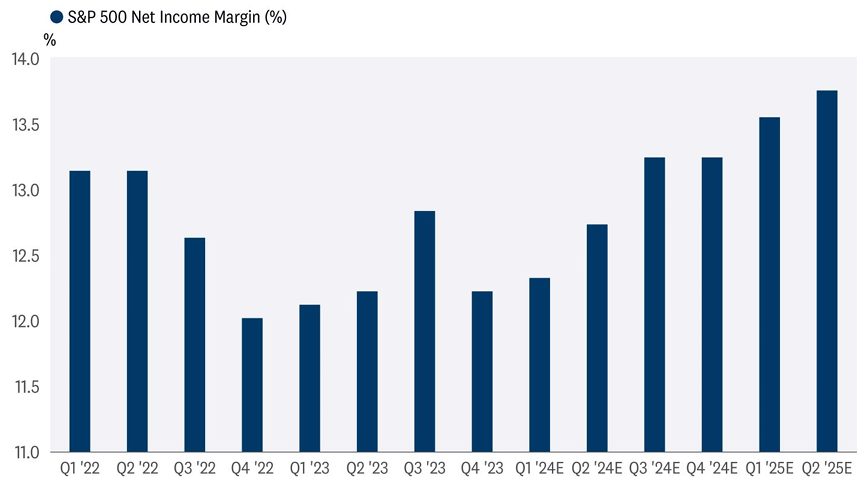
Source: LPL Research, Bloomberg 05/23/24
Indexes are unmanaged and cannot be invested in directly. Estimates may not develop as predicted. Past performance is no guarantee of future results.
BIG TECH AGAIN DRIVES ALL THE GROWTH
We had expected mega cap technology to again drive all the earnings growth for the S&P 500 in the first quarter, and that is exactly what happened. The biggest earnings growers, namely Alphabet (GOOG/L), Amazon (AMZN), Meta (META), Microsoft (MSFT), and NVIDIA (NVDA), drove 7.8 points of S&P 500 EPS growth in the quarter, which means the rest of the market in aggregate — call it the S&P 495 — experienced a 1% year-over-year drop in earnings. Growth among the mega caps is really impressive, with earnings for NVDA surging +468%, Amazon +221%, Meta +111%, and GOOG/L a not-too-shabby +56%. Guidance was also upbeat, with particular strength in AMZN and GOOG/L, which both saw estimates rise 9–10% for 2024 and 2025. NVDA’s estimates increased 2% and 5% for this year and next.
This concentration of earnings power has some investors worried. But more balanced earnings growth will likely come by the end of the year as earnings growth outside of mega cap technology accelerates, and the law of large numbers contributes to slower growth for the space. This may contribute to better performance for value stocks, but we think it’s still a bit too early to make that shift given the strength in artificial intelligence (AI). As the chart below illustrates, AI has been a hot topic on company earnings calls this quarter, and it’s not just the AI companies talking. That means more productivity is likely coming, and with it comes greater profitability for corporate America.
DISCUSSIONS OF AI RAMPING UP AS WORRIES ABOUT THE ECONOMY FADE
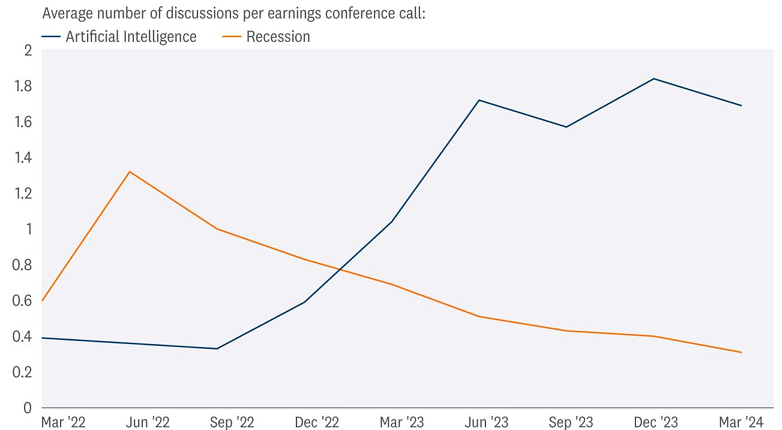
Source: LPL Research, Bloomberg 05/23/24
OUR ESTIMATES APPEAR CONSERVATIVE
Upside to earnings estimates is par for the course, but guidance is where an earnings season can go from good to great. On that score, this earnings season was great, as estimates rose for this year and next — an unusual occurrence. Again, big tech was a big part of the story as estimates for 2024 and 2025 rose an average of 4.5% for the top five technology names. For the S&P 500 as a whole, estimates rose about 0.5%, compared with an average reduction historically near 2%.
That suggests the current consensus estimate for S&P 500 EPS near $243 for 2024 may be achievable (we will likely raise our $235 estimate in our upcoming Midyear Outlook publication). AI is providing a boost, while the U.S. economy is showing signs of picking up after the soft first quarter, and earnings declines from healthcare and natural resources may reverse. The challenge is maintaining pricing power under disinflationary conditions. And currency could potentially be a headwind if the dollar strengthens.
Looking out to 2025, slower economic growth may present a headwind. But if the AI capital investment cycle remains strong, then another year of high-single-digit earnings growth next year is quite possible. Our $250 estimate for S&P 500 EPS in 2025, much like our estimate for 2024, is probably too low, so expect that number to also be revised in Midyear Outlook 2024, due out in early July.
2024 AND 2025 EARNINGS ESTIMATES KEEP DRIFTING HIGHER
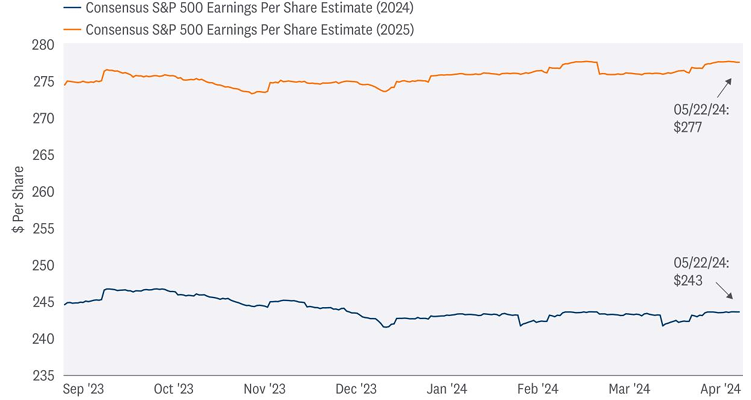
Source: LPL Research, FactSet, as of 05/23/24
Indexes are unmanaged and cannot be invested in directly. Estimates may not materialize as predicted. Past performance is no guarantee of future results.
CONCLUSION
First quarter earnings season was excellent. Corporate America delivered when it needed to — when stock valuations had gotten more elevated after a strong run and weren’t getting much support from lower interest rates. Earnings growth rates were stronger than anticipated, and upbeat guidance caused analysts to increase estimates.
If companies can deliver near-consensus earnings estimates in 2024, buoyed by big tech, and inflation resumes its downward trajectory, enabling a soft landing, then we believe stocks stand a good chance of adding to year-to-date gains through year-end and hold a price-to-earnings ratio (P/E) over 20. If a slowing economy weighs on earnings in the second half and inflation remains frustratingly sticky, then we would consider fair value for the S&P 500 at year-end to be closer to our original prediction in the 4,850–4,950 range.
ASSET ALLOCATION INSIGHTS
LPL’s Strategic and Tactical Asset Allocation Committee (STAAC) maintains its tactical neutral stance on equities. Steady economic and earnings growth this year has kept the risk-reward trade-off for stocks and bonds fairly well balanced, but moving forward, with valuations for stocks elevated and bonds offering more attractive yields, we believe bonds hold a slight edge over stocks. Strong year-to-date stock market gains may have pulled forward some potential gains from Federal Reserve rate cuts, potentially leaving limited upside and more volatility over the balance of 2024 if the economy slows.
Within equities, the STAAC continues to favor a tilt in the Tactical Asset Allocation (TAA) toward domestic over international equities, with a preference for Japan among developed markets, and an underweight position in emerging markets (EM). The Committee recommends a very modest tilt toward the growth style after reducing its overweight position in mid-March, in favor of adding small caps to remove that underweight position. Finally, the STAAC continues to recommend a modest overweight to fixed income, funded from cash.
IMPORTANT DISCLOSURES
This material is for general information only and is not intended to provide specific advice or recommendations for any individual. There is no assurance that the views or strategies discussed are suitable for all investors or will yield positive outcomes. Investing involves risks including possible loss of principal. Any economic forecasts set forth may not develop as predicted and are subject to change.
References to markets, asset classes, and sectors are generally regarding the corresponding market index. Indexes are unmanaged statistical composites and cannot be invested into directly. Index performance is not indicative of the performance of any investment and do not reflect fees, expenses, or sales charges. All performance referenced is historical and is no guarantee of future results.
Any company names noted herein are for educational purposes only and not an indication of trading intent or a solicitation of their products or services. LPL Financial doesn’t provide research on individual equities.
All information is believed to be from reliable sources; however, LPL Financial makes no representation as to its completeness or accuracy.
US Treasuries may be considered “safe haven” investments but do carry some degree of risk including interest rate, credit, and market risk. Bonds are subject to market and interest rate risk if sold prior to maturity. Bond values will decline as interest rates rise and bonds are subject to availability and change in price.
The Standard & Poor’s 500 Index (S&P500) is a capitalization-weighted index of 500 stocks designed to measure performance of the broad domestic economy through changes in the aggregate market value of 500 stocks representing all major industries.
The PE ratio (price-to-earnings ratio) is a measure of the price paid for a share relative to the annual net income or profit earned by the firm per share. It is a financial ratio used for valuation: a higher PE ratio means that investors are paying more for each unit of net income, so the stock is more expensive compared to one with lower PE ratio.
Earnings per share (EPS) is the portion of a company’s profit allocated to each outstanding share of common stock. EPS serves as an indicator of a company’s profitability. Earnings per share is generally considered to be the single most important variable in determining a share’s price. It is also a major component used to calculate the price-to-earnings valuation ratio.
All index data from FactSet.
Value investments can perform differently from the market as a whole. They can remain undervalued by the market for long periods of time.
The prices of small cap stocks are generally more volatile than large cap stocks.
International investing involves special risks such as currency fluctuation and political instability and may not be suitable for all investors. These risks are often heightened for investments in emerging markets.
LPL Financial does not provide investment banking services and does not engage in initial public offerings or merger and acquisition activities.
This research material has been prepared by LPL Financial LLC.
Securities and advisory services offered through LPL Financial (LPL), a registered investment advisor and broker-dealer (member FINRA/SIPC). Insurance products are offered through LPL or its licensed affiliates. To the extent you are receiving investment advice from a separately registered independent investment advisor that is not an LPL affiliate, please note LPL makes no representation with respect to such entity.
Not Insured by FDIC/NCUA or Any Other Government Agency | Not Bank/Credit Union Deposits or Obligations | Not Bank/Credit Union Guaranteed | May Lose Value
RES-0001182-0424 | For Public Use | Tracking #583393 (Exp. 05/2025)