Corporate America did it again. Companies blew by estimates and made strategists and analysts look silly (though we humbly suggest that we may have looked less silly than most in our earnings preview on July 12). S&P 500 earnings growth did not surprise by quite as much as in the first quarter, but came pretty close—boosted by the biggest quarterly upside revenue surprise in at least 13 years. Here, we recap the strong numbers and raise our forecasts for earnings and for S&P 500 fair value at year-end.
BLOWOUT NUMBERS…AGAIN
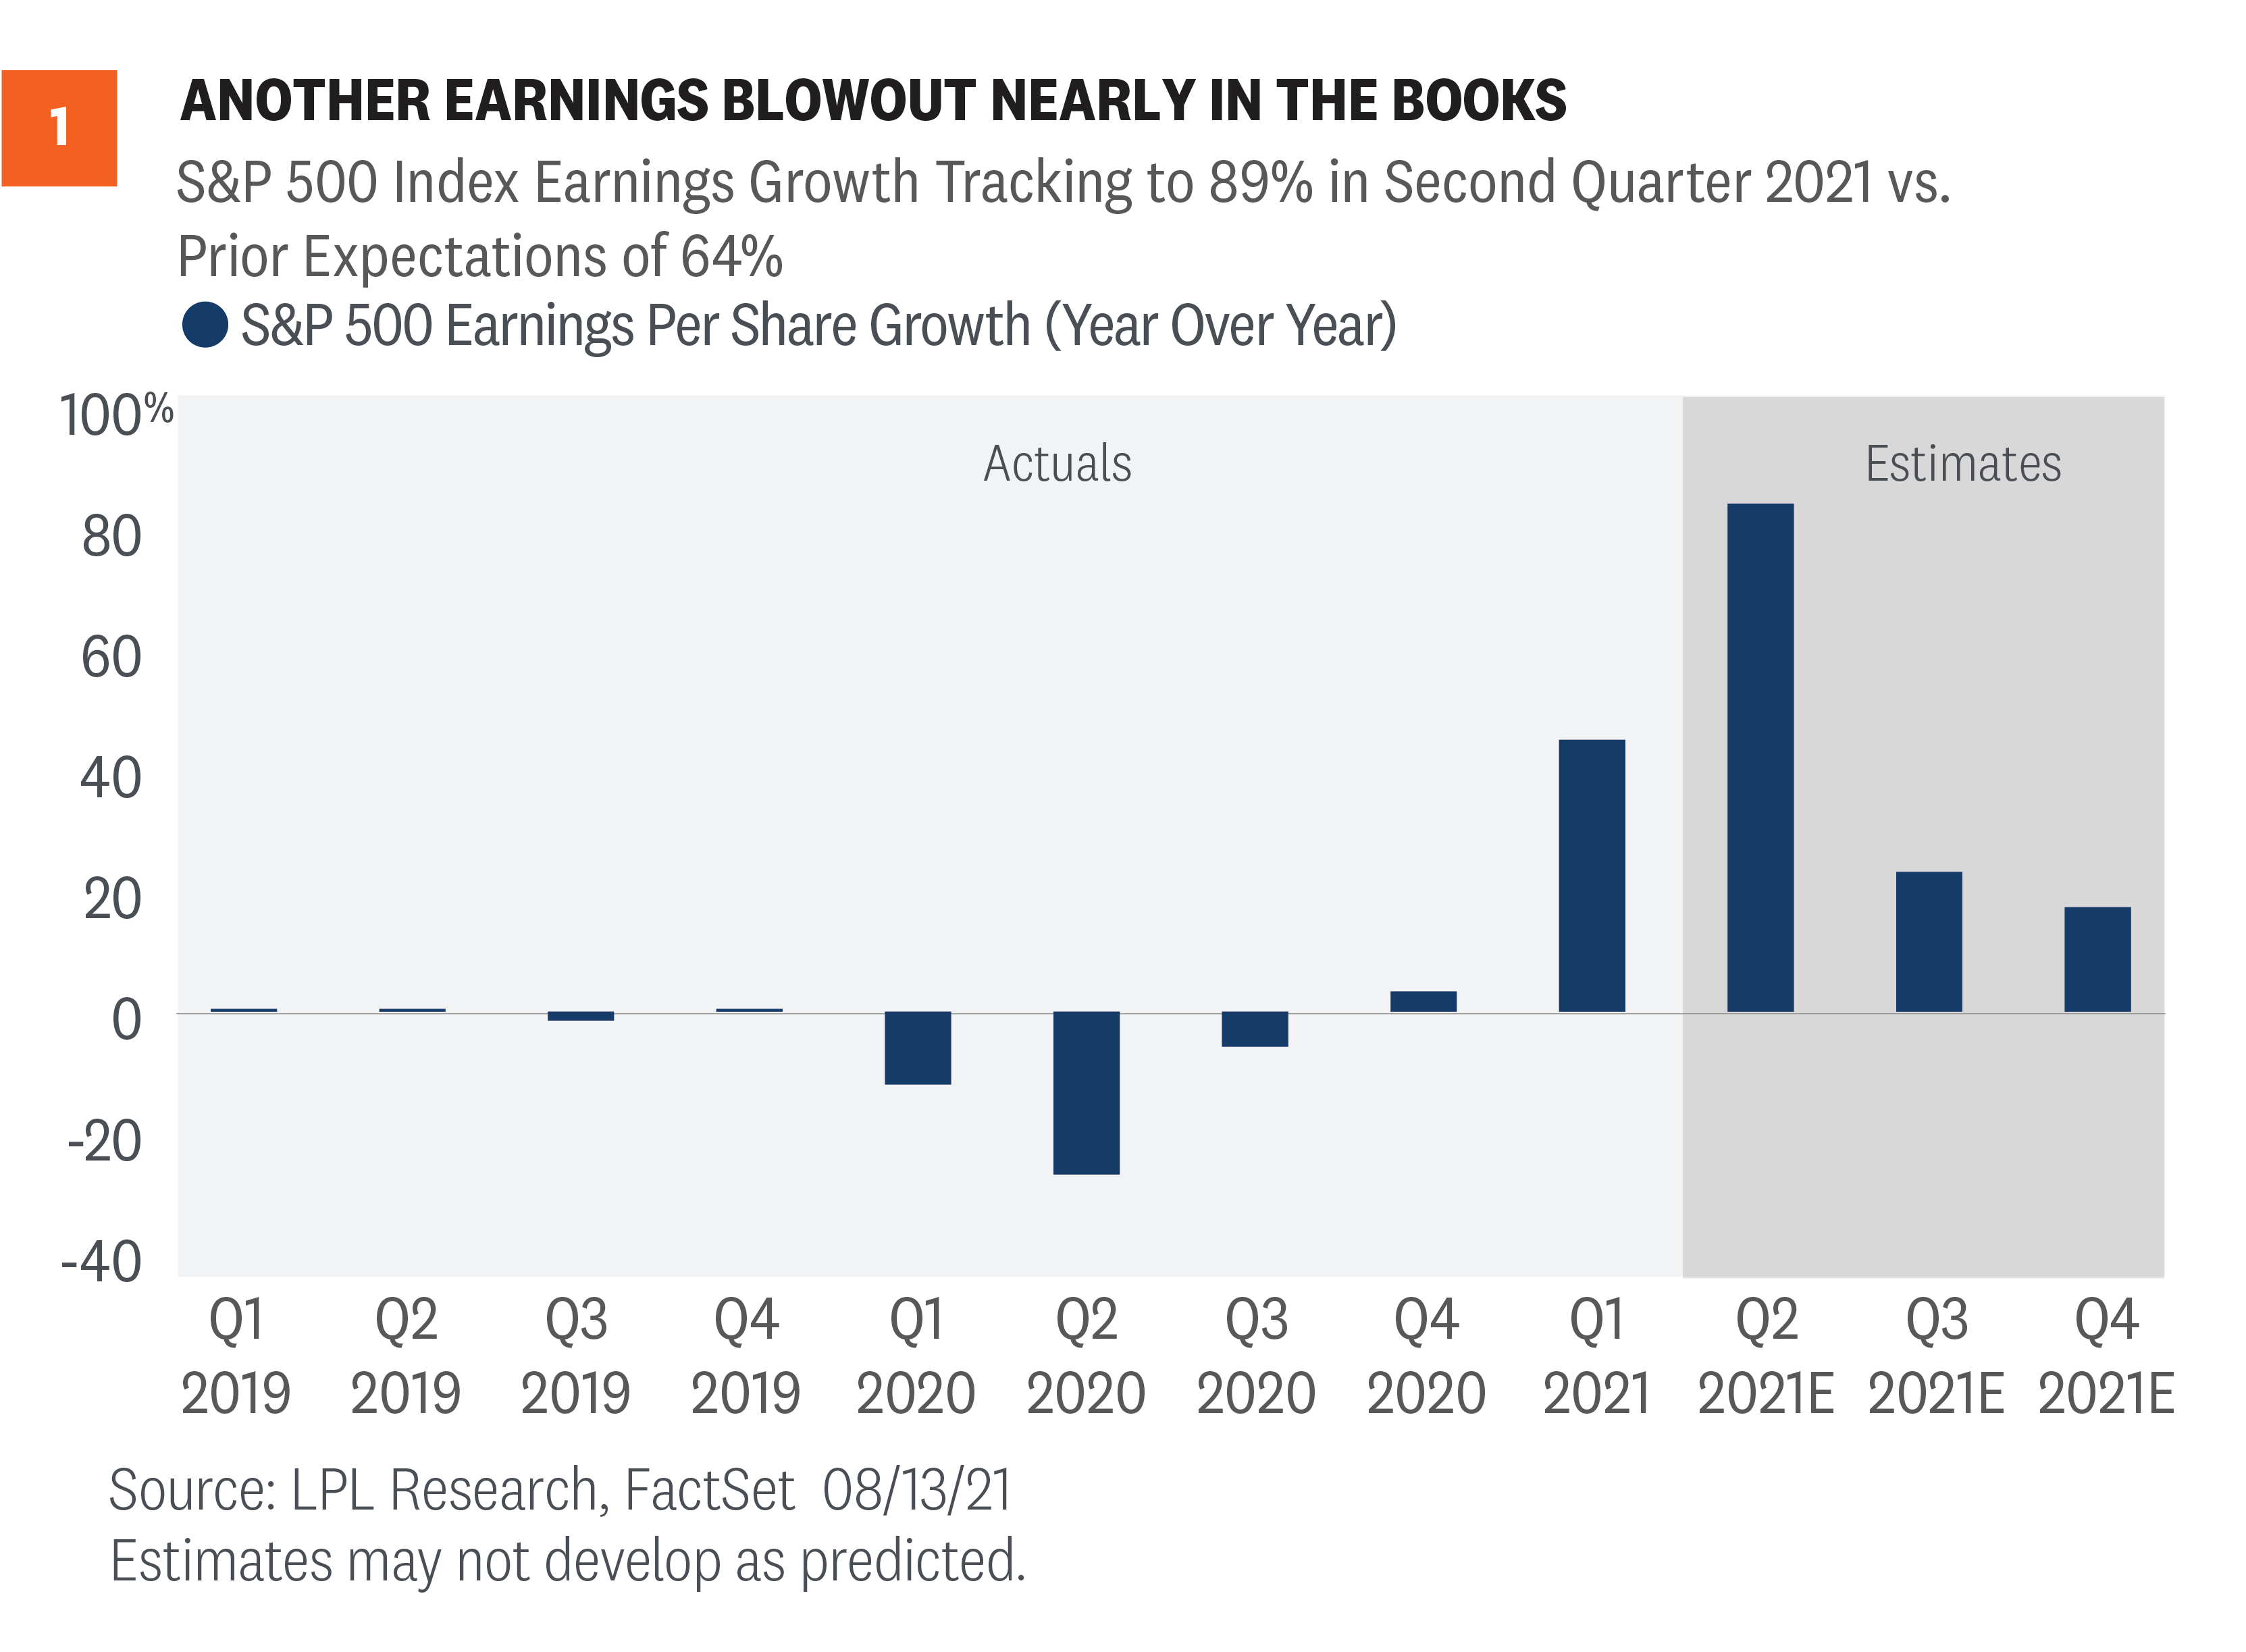
In our earnings preview commentary in mid-July, we wrote that we expected another quarter of solid upside surprises. Huge earnings growth rates were never in question, considering that so much of the U.S. economy was shut down during the year-ago quarter. But strong second-quarter economic data and rising earnings estimates pointed to faster earnings growth than the consensus estimate implied on July 1.
As shown in [Figure 1], S&P 500 earnings are tracking to a nearly 90% year-over-year increase, or about 25 percentage points above the consensus estimate when earnings season began. While a remarkable amount of upside, and still with 8% of S&P 500 companies left to report, it stands about 3 percentage points shy of the first quarter’s mind-blowing numbers when earnings grew 52% compared with the 24% estimate on April 1.
Estimates are usually too low, but this amount of upside isn’t normal. Analysts and strategists often miss turns in economic conditions and underestimate companies’ ability to adapt to changing conditions. However, after four consecutive quarters of huge upside surprises, we expected analysts to catch up more quickly. The average upside since 2010 is about 6%, so a 10-point beat is spectacular. Two 20-point beats in a row is ridiculous.
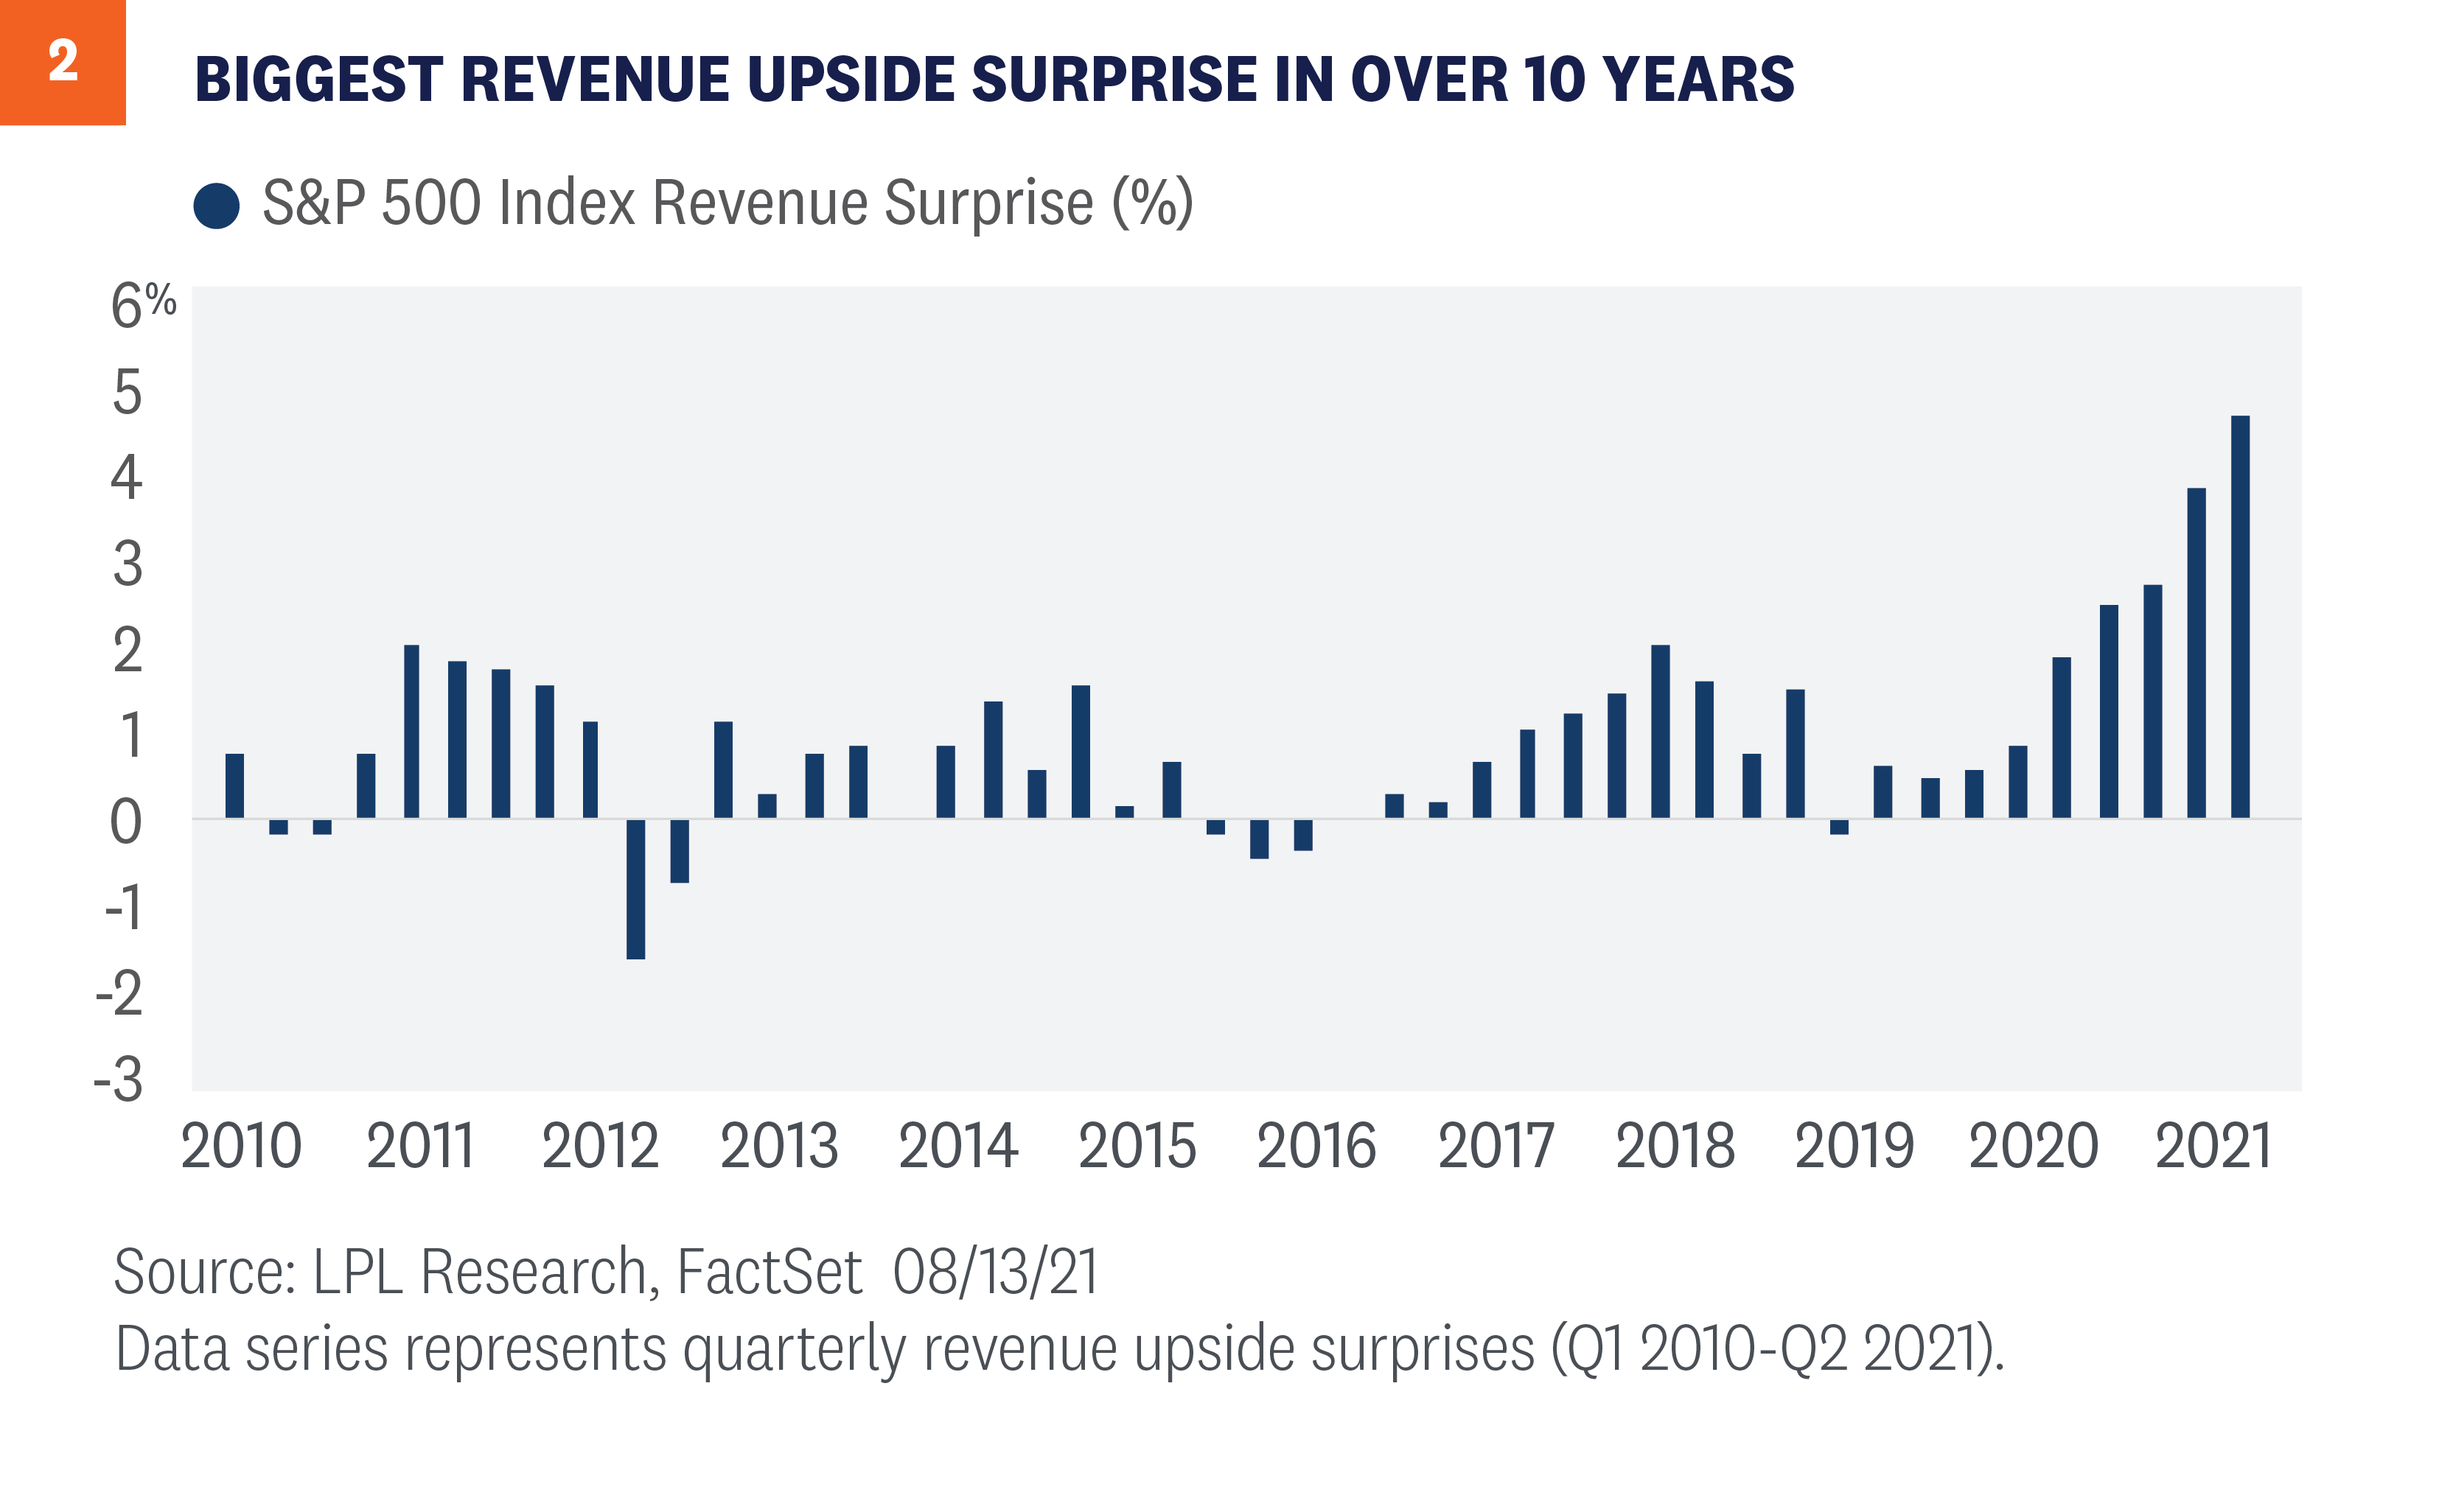
Revenue upside was especially impressive during the quarter, reflecting the improving economy and strong pricing power enjoyed by leading companies. In fact, the second quarter produced the biggest upside surprise to revenue ever recorded at 4.9 percentage points, breaking last quarter’s record of 4 points [Figure 2]. Energy more than doubled revenue year-over-year and delivered a more than 11% upside revenue surprise—the largest among all S&P 500 sectors. Revenue upside is encouraging because it is more likely to be sustained than cost cuts to prop up profit margins.
WHAT HAVE ANALYSTS MISSED?
Here are some of the reasons why we think analysts again dramatically underestimated the earnings power of corporate America during the second quarter:
- Reopening continued largely uninterrupted. Steady progress in the reopening continued through June, perhaps catching some analysts off guard late in the quarter when the Delta variant of COVID-19 became more prevalent. Measures of mobility were generally resilient throughout the quarter.
- Analysts may be too “micro” focused. Strong consumer spending and manufacturing activity might have both been underestimated again because analysts are too focused on the “micro,” leaving a structural blind spot to the “macro” picture that includes not only a big reopening push, but also a lot of stimulus spending still working its way through the economy. Caution from company management teams due to the ongoing uncertainty, which has been surprisingly persistent, has also likely been a factor.
- Well-managed input cost pressures. Analysts may have gotten the timing wrong or overestimated the amount of input cost pressures that companies would be able to absorb (likely both). Pricing power has likely been underestimated and helped prop up record-setting margins. These pressures may still hit margins but that may be a quarter or two away.
- Corporate efficiency is off the charts. Profit margins are at record highs, thanks to productivity-enhancing technology spending and cost savings (on business travel, entertainment, or office space, for example). These productivity enhancements will likely continue to bear fruit, though we do worry about wage pressures going forward—and some of those cost savings will likely reverse in coming quarters.
- Financials delivered in a big way. The credit environment remains very healthy, boosting financial company results well beyond what analysts anticipated. Financials were by far the biggest sector contributor to earnings growth, and the average company beat earnings estimates by 27%—second only to consumer discretionary at 28%.
WHAT DO THESE STRONG RESULTS MEAN FOR THE OUTLOOK
The key question now is: Will the strong earnings momentum continue? We think so, although the amount of upside will likely continue to shrink in the second half, as it did between the first and second quarters.
One reason for optimism is that estimates have risen during earnings season amid positive guidance. Nearly 60% of the guidance provided for the third quarter has been positive, well above the 5-year average at 37%. Since July 1, the consensus S&P 500 earnings per share (EPS) estimate has risen from $191 to $201. For 2022, the number has increased from $213 to near $219. Rising estimates tend to be a signal of more strong results ahead.
In addition, although the second quarter may represent the peak of economic growth for this expansion, inventories need to be restocked. Second quarter 2021 gross domestic product (GDP) missed expectations largely because of inventory drawdowns. Restocking lifts earnings, on top of the likely boost from the reopening and stimulus.
With substantially better second-quarter earnings results than we anticipated, rising forward estimates, and the strong economic growth outlook, our 2021 S&P 500 EPS estimate of $195 looks low. Maintaining the second-quarter EPS level for the next two quarters will put S&P 500 EPS at $205 for the full year 2021, a 46% year-over-year increase. Although our second-half estimates may appear conservative, we believe our forecast is reasonable given the risks surrounding the Delta variant and potential margin pressures (and consider consensus is only at $201).
We have also raised our S&P 500 EPS forecast for 2022, from $205 to $218. We considered a higher forecast, but corporate tax increases are likely coming next year (in our view—we put the odds at about 70%). If those tax increases don’t happen, then we could potentially see S&P 500 EPS in 2022 of $225 or higher.
RAISING S&P 500 FAIR VALUE TARGET
As a result of the stronger earnings outlook, we are raising our 2021 year-end S&P 500 fair value target range from 4,400 – 4,450 to 4,650 – 4,700. The new target is based on a 21.5 PE and our revised 2022 S&P 500 EPS forecast. The midpoint of the new S&P 500 fair value target is 5% above the August 13 close and 5% above the midpoint of our prior target.
We acknowledge there are risks to that higher forecast, with the Delta variant topping the list. Other concerns include potential “sticky” inflation, tax increases, historic deficit spending, U.S.-China tensions, and other geopolitical risks. We are also keenly aware that the second year of bull markets has historically brought more market volatility, the S&P 500 hasn’t experienced a 5% pullback in 10 months, stocks have already outpaced their average gain for the second year of a bull market, and August and September have historically been weaker months for stocks.
So, while our base case is for stocks to add to stellar 2021 returns over the next four months, we remain on the lookout for bumps in the road as we discussed in our Midyear Outlook 2021: Picking Up Speed.
Click here to download a PDF of this report.
______________________________________________________________________________________________
IMPORTANT DISCLOSURES
This material is for general information only and is not intended to provide specific advice or recommendations for any individual. There is no assurance that the views or strategies discussed are suitable for all investors or will yield positive outcomes. Investing involves risks including possible loss of principal. Any economic forecasts set forth may not develop as predicted and are subject to change.
References to markets, asset classes, and sectors are generally regarding the corresponding market index. Indexes are unmanaged statistical composites and cannot be invested into directly. Index performance is not indicative of the performance of any investment and do not reflect fees, expenses, or sales charges. All performance referenced is historical and is no guarantee of future results.
Any company names noted herein are for educational purposes only and not an indication of trading intent or a solicitation of their products or services. LPL Financial doesn’t provide research on individual equities.
All information is believed to be from reliable sources; however, LPL Financial makes no representation as to its completeness or accuracy.
US Treasuries may be considered “safe haven” investments but do carry some degree of risk including interest rate, credit, and market risk. Bonds are subject to market and interest rate risk if sold prior to maturity. Bond values will decline as interest rates rise and bonds are subject to availability and change in price.
The Standard & Poor’s 500 Index (S&P500) is a capitalization-weighted index of 500 stocks designed to measure performance of the broad domestic economy through changes in the aggregate market value of 500 stocks representing all major industries.
The PE ratio (price-to-earnings ratio) is a measure of the price paid for a share relative to the annual net income or profit earned by the firm per share. It is a financial ratio used for valuation: a higher PE ratio means that investors are paying more for each unit of net income, so the stock is more expensive compared to one with lower PE ratio.
Earnings per share (EPS) is the portion of a company’s profit allocated to each outstanding share of common stock. EPS serves as an indicator of a company’s profitability. Earnings per share is generally considered to be the single most important variable in determining a share’s price. It is also a major component used to calculate the price-to-earnings valuation ratio.
All index data from FactSet.
Please read the full Midyear Outlook 2021: Picking Up Speed publication for additional description and disclosure.
This research material has been prepared by LPL Financial LLC.
Securities and advisory services offered through LPL Financial (LPL), a registered investment advisor and broker-dealer (member FINRA/SIPC). Insurance products are offered through LPL or its licensed affiliates. To the extent you are receiving investment advice from a separately registered independent investment advisor that is not an LPL affiliate, please note LPL makes no representation with respect to such entity.
Not Insured by FDIC/NCUA or Any Other Government Agency | Not Bank/Credit Union Guaranteed | Not Bank/Credit Union Deposits or Obligations | May Lose Value
RES-857551-0821 | For Public Use | Tracking # 1-05179575 (Exp. 08/22)